Finally!
The ElephantSQL team are happy to announce that you're now able to ship monitoring data from your dedicated instances to an integrated monitoring service. These integrations will help you to protect against and to identify issues with your instance since it can help you to keep full track of your instances well being over time.
At this moment, we support the following external metrics integrations:
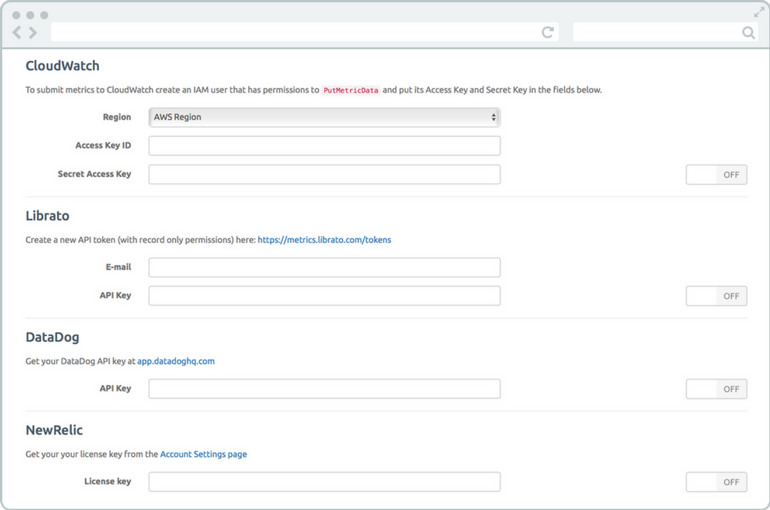
CloudWatch
AWS CloudWatch makes it possible to ship CPU, memory and disk metrics of dedicated instances. Information regarding your instance can be sent to CloudWatch external metric service.
Enter the Amazon Access Key ID and Secret Access Key of your Amazon account.
Librato
Librato can give you full-stack monitoring in minutes. It makes it easy to centralize monitoring from many environments.
Sign up and create a token
here.
Datadog
DataDog enables you to seamlessly aggregate metrics and events across the full DevOps stack. It allows you to see all data in one place.
Sign up and get your DataDog API key
here.
New Relic
New Relic integration enables you to collect and visualize various metrics from ElephantSQL.
Enter your license key from the NewRelic plugin page to enable the plugin.
You can find all ElephantSQL integration options under the Integration tab in the control panel for your instances.