Product Tour
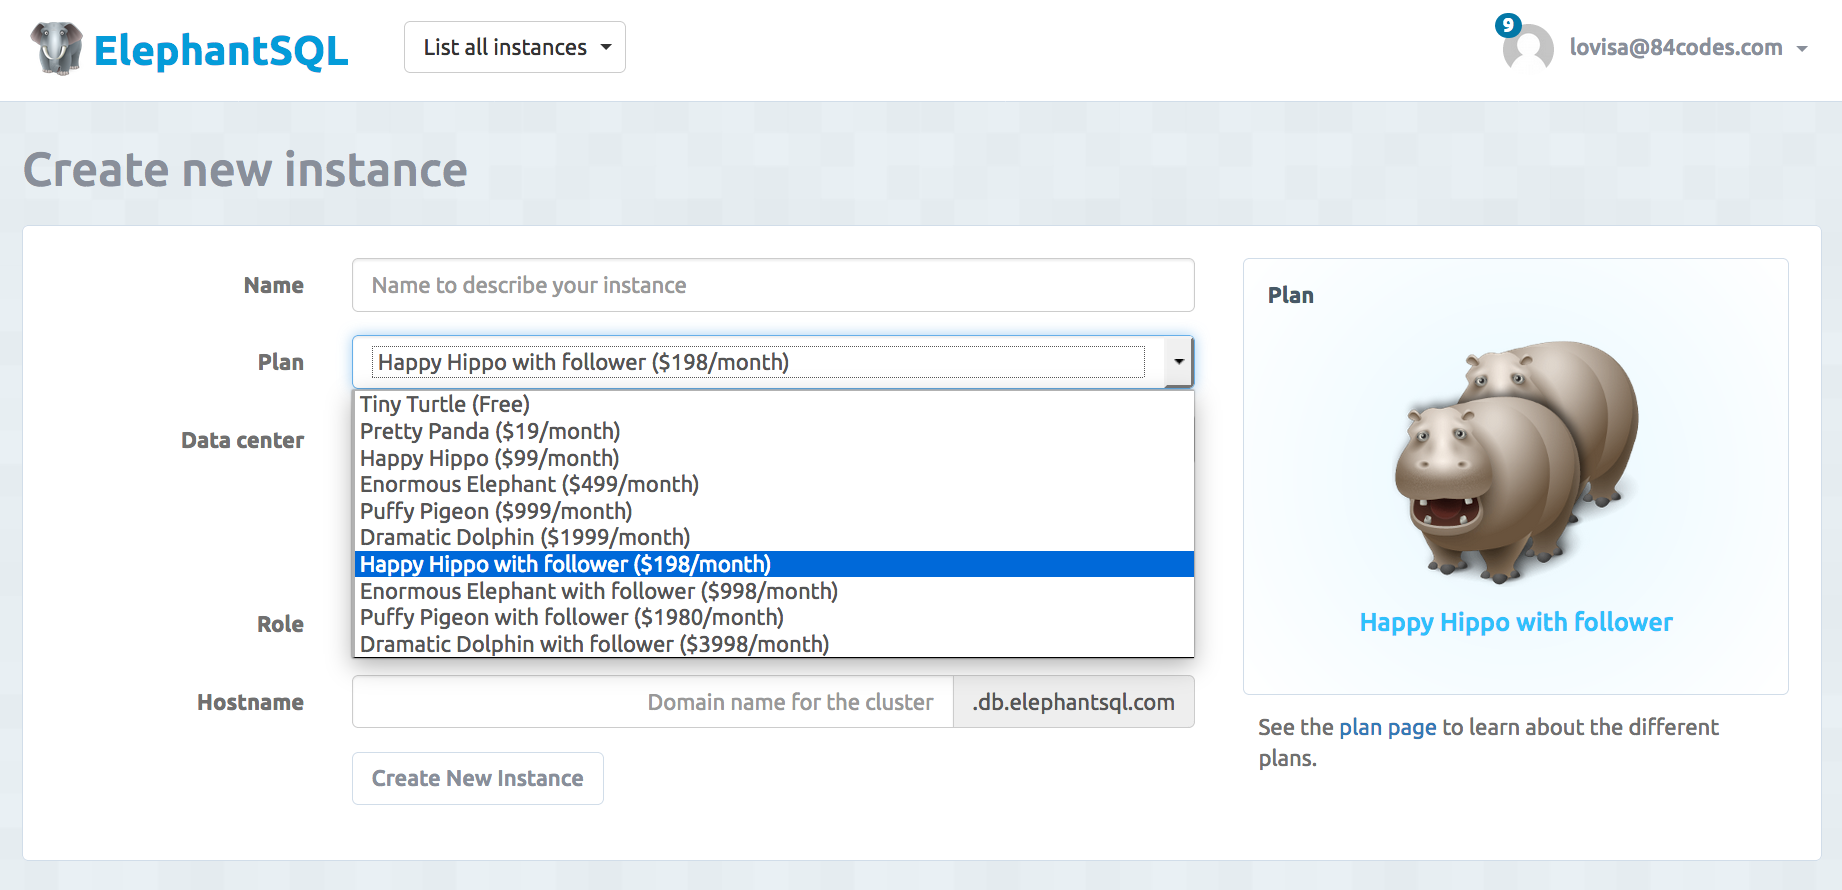
ElephantSQL offer tools to simplify the usage of the PostgreSQL database. Various monitoring tools will help you to overview server metrics, backups are handled automatically and we make it very easy to do Point in time recovery. The instance details, such as connection URL, statistics, open connections and your slow queries can be seen at the details pages in the Control Panel. Here you will also be able to restore backups and rotate your password. If you are on a dedicated plan (Happy Hippo or larger) you will be able to view server metrics, you can set up followers and you can view information for all your databases.
Backups
Automated backups are performed every day on all paid plans. These are stored in a cloud file storage so they are always accessible to you (same cloud as your instance). The last month's backup files can be found and downloaded in the ElephanSQL Control Panel.
The backups are compressed with
lzop,
to restore the data you can usually use the following:
lzop -cd "$FILE_NAME" | psql "$DATABASE_NAME"
For dedicated server: Full backups of the whole server is performed every week.
Backup API
A backup API is available, that allows you to list, create, and restore from backups programmatically.

Database statistics
Cache Hit Rate
Usually (in many applications) only a fraction of the data is regularly accessed. Postgres is tracking access patterns of data and will on its own keep frequently accessed data in cache. Cache hit rate show how many of your indexes that are within your cache. Generally you want your database to have a cache hit rate of about 99%.

Index usage
If you’re not somewhere around 99% on any table over 10,000 rows you may want to consider adding an index. Indexes are most valuable across very large tables. When examining where to add an index you should look at what kind of queries you’re running and add indexs to some other id or on values that you’re commonly filtering.
Index Hit Rate
Show how many of your indexes that are within your cache. You should have an index hit rate around 99%, similar to your regular cache hit rate.
Connections
Open connections can be see in the tab open connections. You have the option to terminate a connection from the connection tab.
Slow queries
Identify which queries that are running slowly in your system by checking the slow queries tab. Inefficient SQL queries can kill the performance of your application.

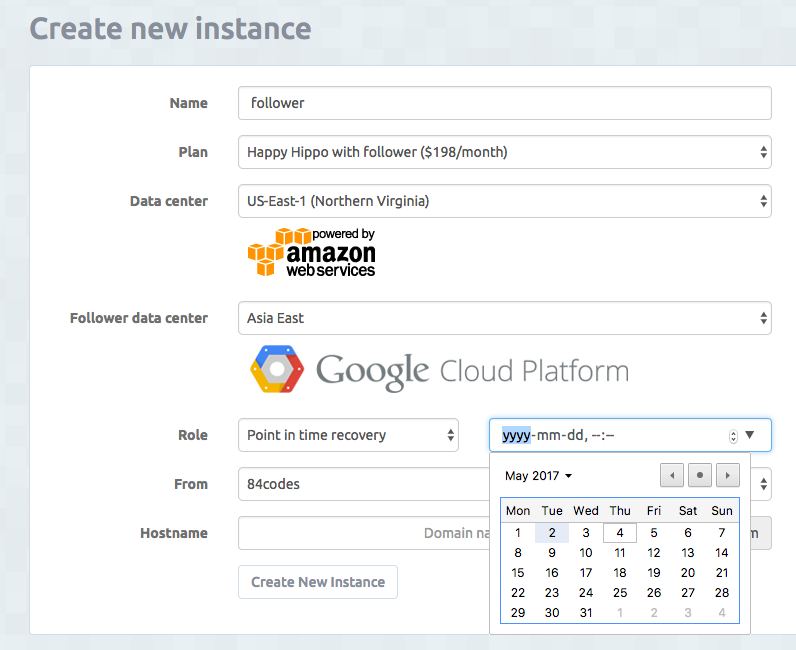
Point in time recovery
For dedicated plans only
Full backups of the whole server is performed every week and WAL backups are uploaded every minute to S3. These backups can be used for disaster recovery as well as for point-in-time-recovery.

Followers (High Availability plans)
For dedicated plans only
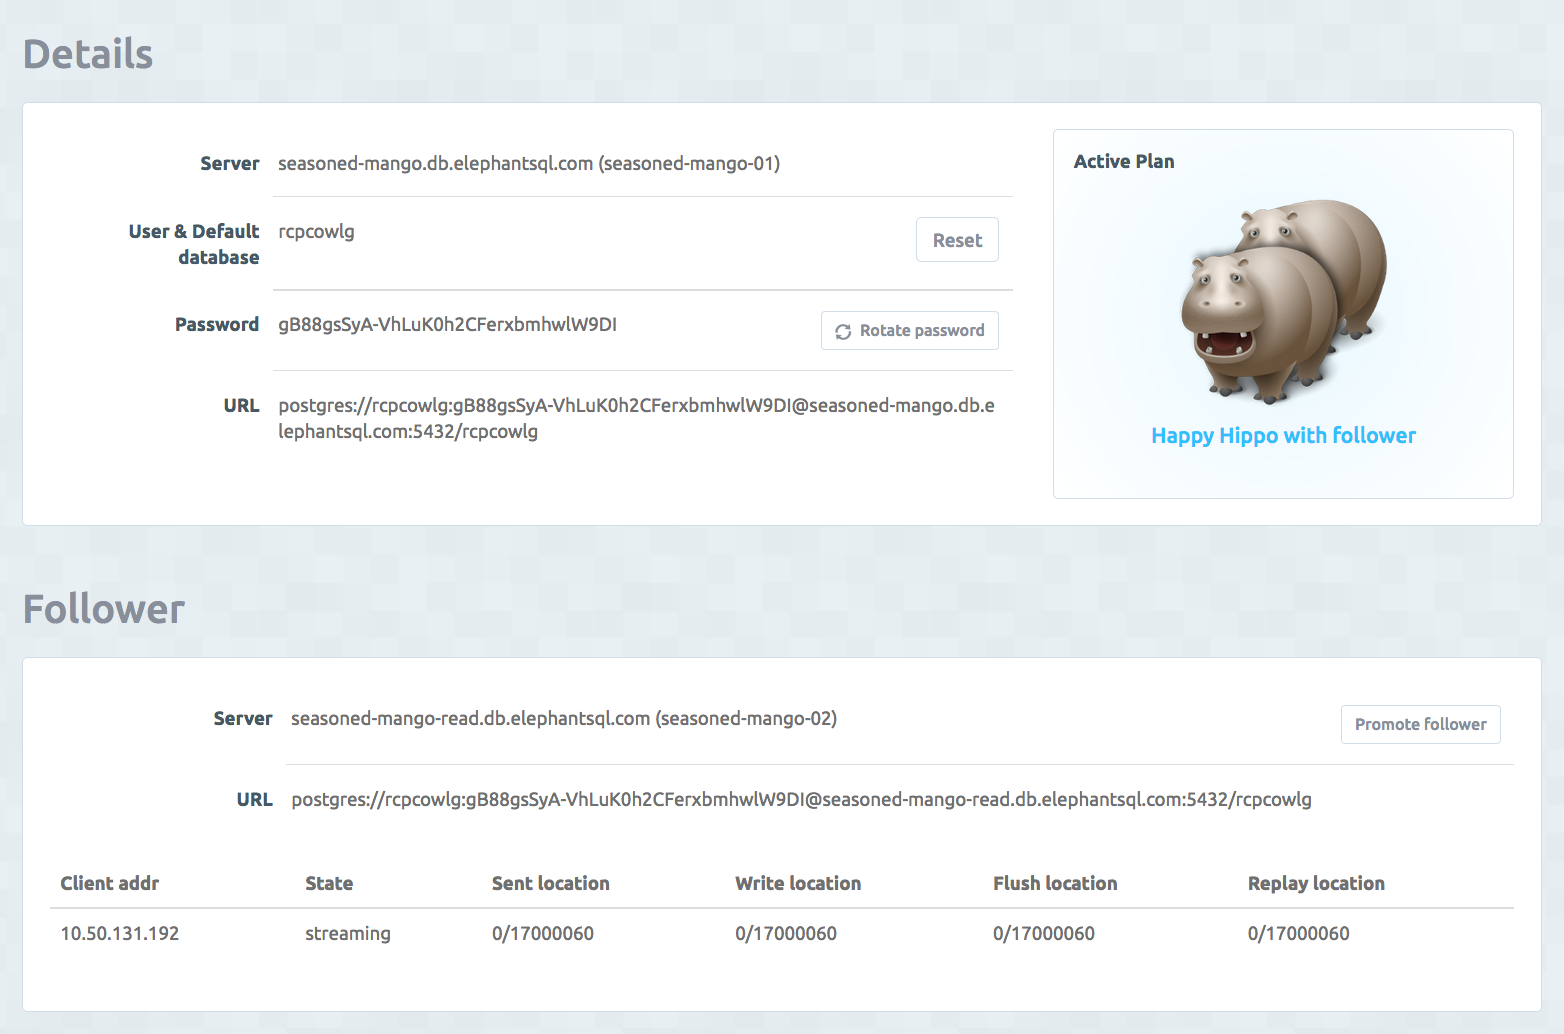
On ElephantSQL you can always spread your data across multiple data centers and cloud providers. You can ensure that your data is always accessible and maximizing uptime by adding a follower to your database. A follower is a read-only copy of the leader database but it can at any time be promoted to accept new writes and updates. It will be a hot-standby ready to take over if you main database crashes. When data is modified and committed on the leader database the changes are streamed to the follower databases. You can view your followers and add followers from the Control Panel of your instance.
The follower will be promoted automatically by ElephantSQL in situations where the primary database becomes corrupted or unavailable. Failover is set to 30 seconds. Of course is manual failover also available. The follower to a database (in AWS) is physically located in a different availability zone (AZ), to protect against AZ-wide failures.
The follower will be available for read only queries. The address to the follower of your leader node can be found in "details" for your instance (e.g. seasoned-mango-read.db.elephantsql.com) as in the picture below.
It's important to reconnect the clients when they are being disconnected during failover. During failover is the DNS records for the leader and follower updated so make sure your clients create new connections if connection is lost, This is handled differently in different client libraries. Some libs need to create a new connection while other client libraries are handling the failover.
Fork
For dedicated plans only
When you want to move your database to a different data center, migrate to a new cloud, or create a copy of all your data for test - ElephantSQL can easily help you create a standalone copy of your database.
SQL Browser
ElephantSQL provides a browser tool for SQL queries where you can create, read, update and delete data direct from your web browser. A link to the browser can be found on the console page for your instance. The different available tables for the database can be found under the tables button to the right.

PostgreSQL Monitoring
Alarms
It is possible to activate alarms and receive accurate alerts based on performance anomalies in your application. The alarms available are CPU, RAM and Memory alarms. Read more about alarms and how to activate them in the monitoring pages.
Server metrics
Server metrics are only available for dedicated instances.
Serve Metrics helps you to measure performance metrics from your server. ElephantSQL shows CPU Usage Monitoring and Memory Usage Monitoring. Read more about server metrics in the monitoring pages.
PostgreSQL Log Stream
The PostgreSQL Log stream is only available for dedicated instances. ElephantSQL Log Stream shows the live log from PostgreSQL.
